Predict. Route. Verify.
Marketing platforms report their own performance. WebSync sits above them, as an independent layer that decides where spend should go and proves what it returned.
Predict outcomes before launch
Creatives, audiences, and channels are ranked by predicted conversion outcome before any budget is committed. Losing variants never ship.
Trained on 6B proprietary impressionsRoute spend where it wins
A single connection reaches 170+ platforms. Spend flows continuously toward the highest predicted return, across every channel at once.
170+ platforms, one connectionVerify it against sales
Every decision is tied to real revenue outcomes in the client's own data.
+45% verified sales uplift, avg D2C// visuals on this page illustrate the system with representative data. Every performance figure we publish is measured on client deployments.
Same budget, two ways of deciding where it goes.
- You find out which creative works by paying for the ones that don't.
- Each platform reports its own performance, in its own numbers.
- Budget shifts happen in a weekly meeting, from last week's data.
- ROAS is whatever the dashboard says.
- Every creative is scored before launch. Losing variants never ship.
- One independent layer above every platform, in one set of numbers.
- Spend moves continuously toward the highest predicted return.
- ROAS is reconciled to your revenue.
Agents do the work. Your team stays in control.
WebSync agents score the ads, move the budget within your limits and check the results against sales and profit. Your team approves every change in one place.
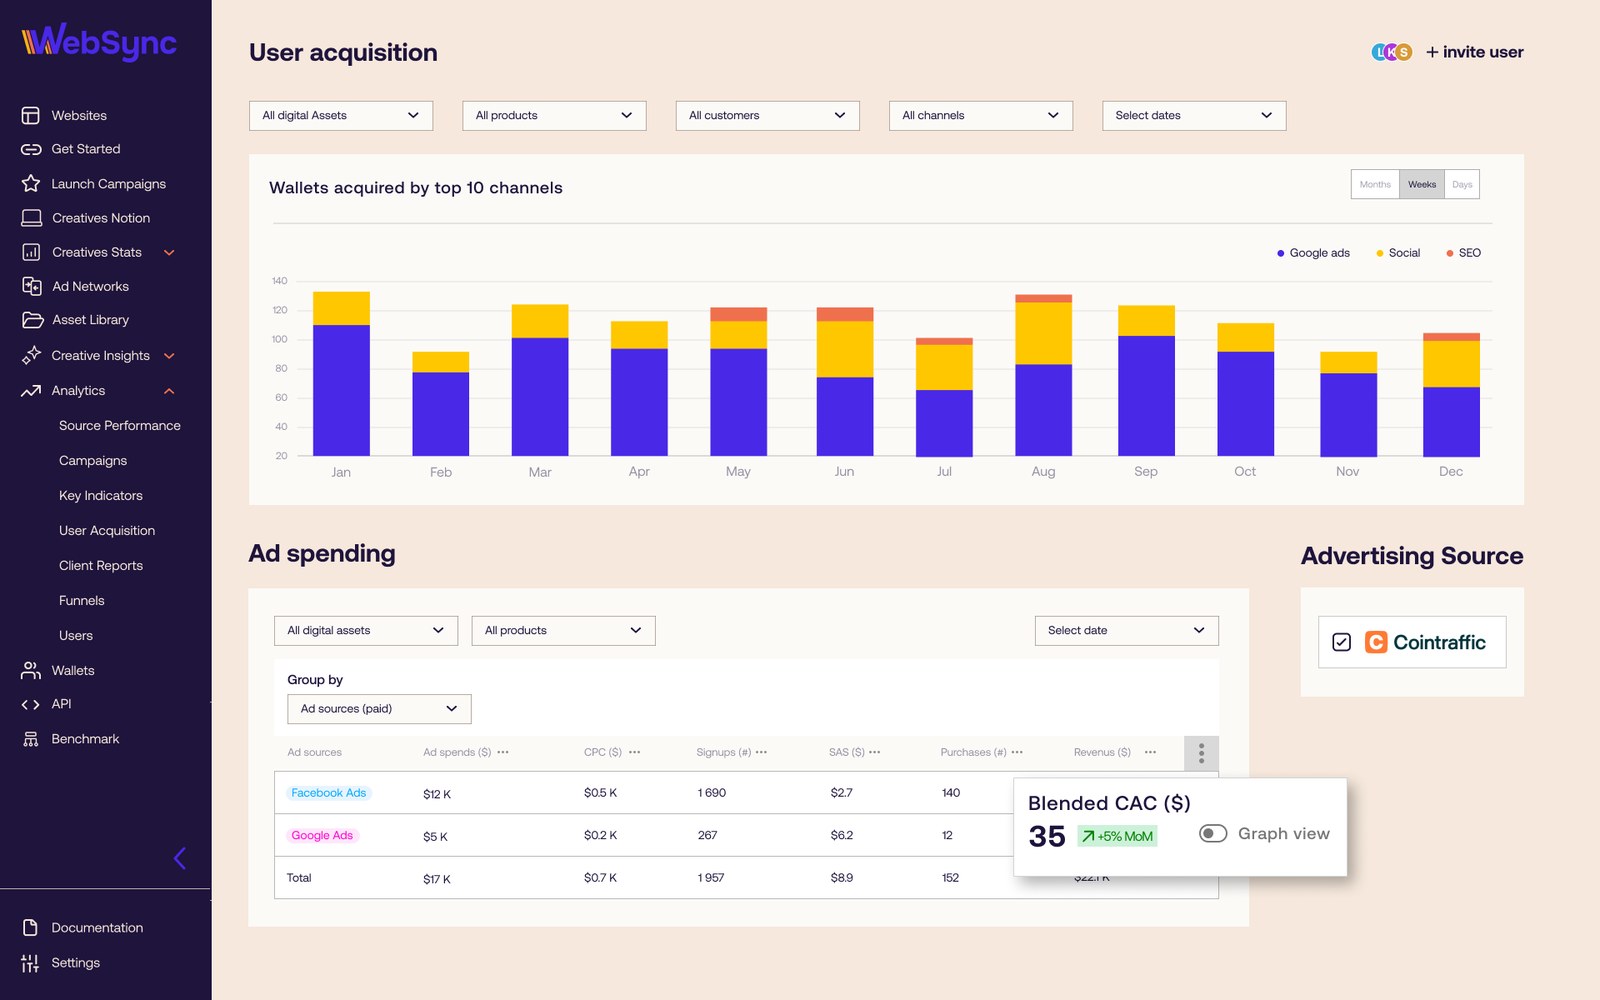
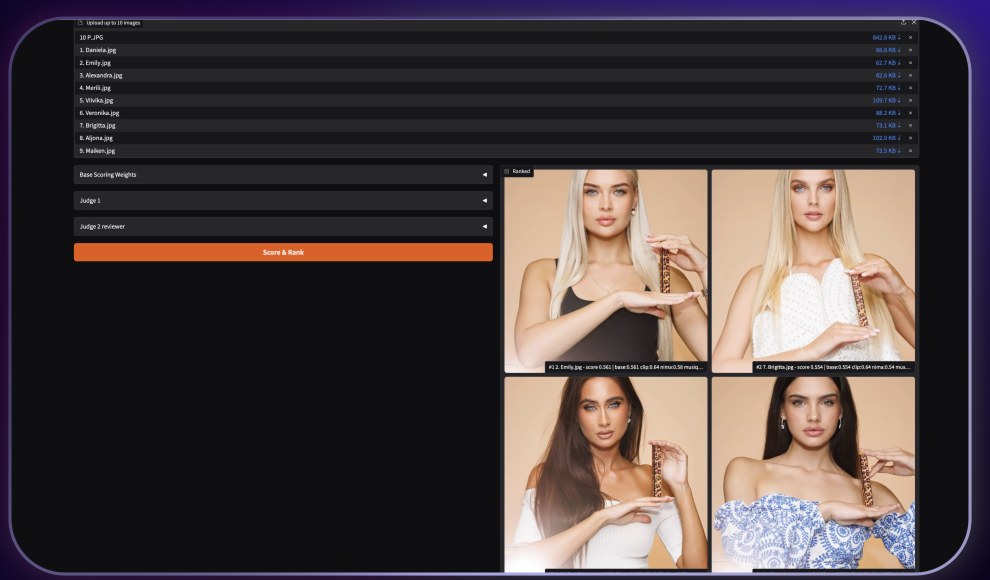
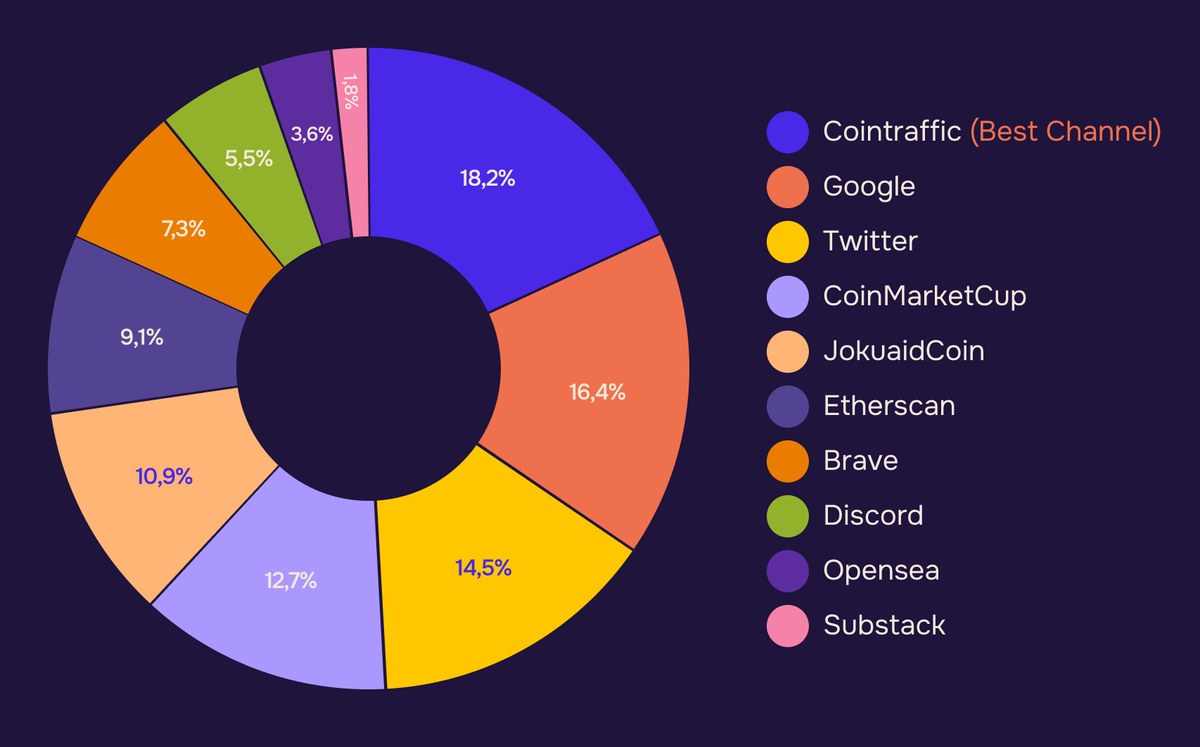
Screens from the live platform. Figures shown are from demo workspaces, not client accounts.
See if prediction can work for your campaigns.
We work directly with a limited number of growth teams. Bring us one active campaign and we will check whether our prediction models can improve what you run and where the budget goes.
- For teams spending $100K+ per month on paid acquisition.
Prefer email? support@websync.ai